Iris Interactive Plots
Introduction
You will see the tutorial for the implementation of interactive plots using NNSOM
Training
Refer Iris Training to see how to train the model before plotting
Data Preparation
Just make sure you are setting the mouse_click flag to True to see interactive plots.
num1 = get_cluster_array(X[:, 0], clust)
num2 = get_cluster_array(X[:, 1], clust)
cat = count_classes_in_cluster(y, clust)

perc_sentosa = get_perc_cluster(y, 0, clust)
iris_class_counts_cluster_array = count_classes_in_cluster(y, clust)
align = np.arange(len(iris_class_counts_cluster_array[0]))
num_classes = count_classes_in_cluster(y, clust)
num_sentosa = num_classes[:, 0]

int_dict = {
    'data': X,
    'target': y,
    'clust': clust,
    'num1': num1,
    'num2': num2,
    'cat': cat,
    'topn': 5,
}

# Interactive hit histogram
fig, ax, patches, text = som.hit_hist(X, mouse_click=True, **int_dict)
plt.show()
Output:
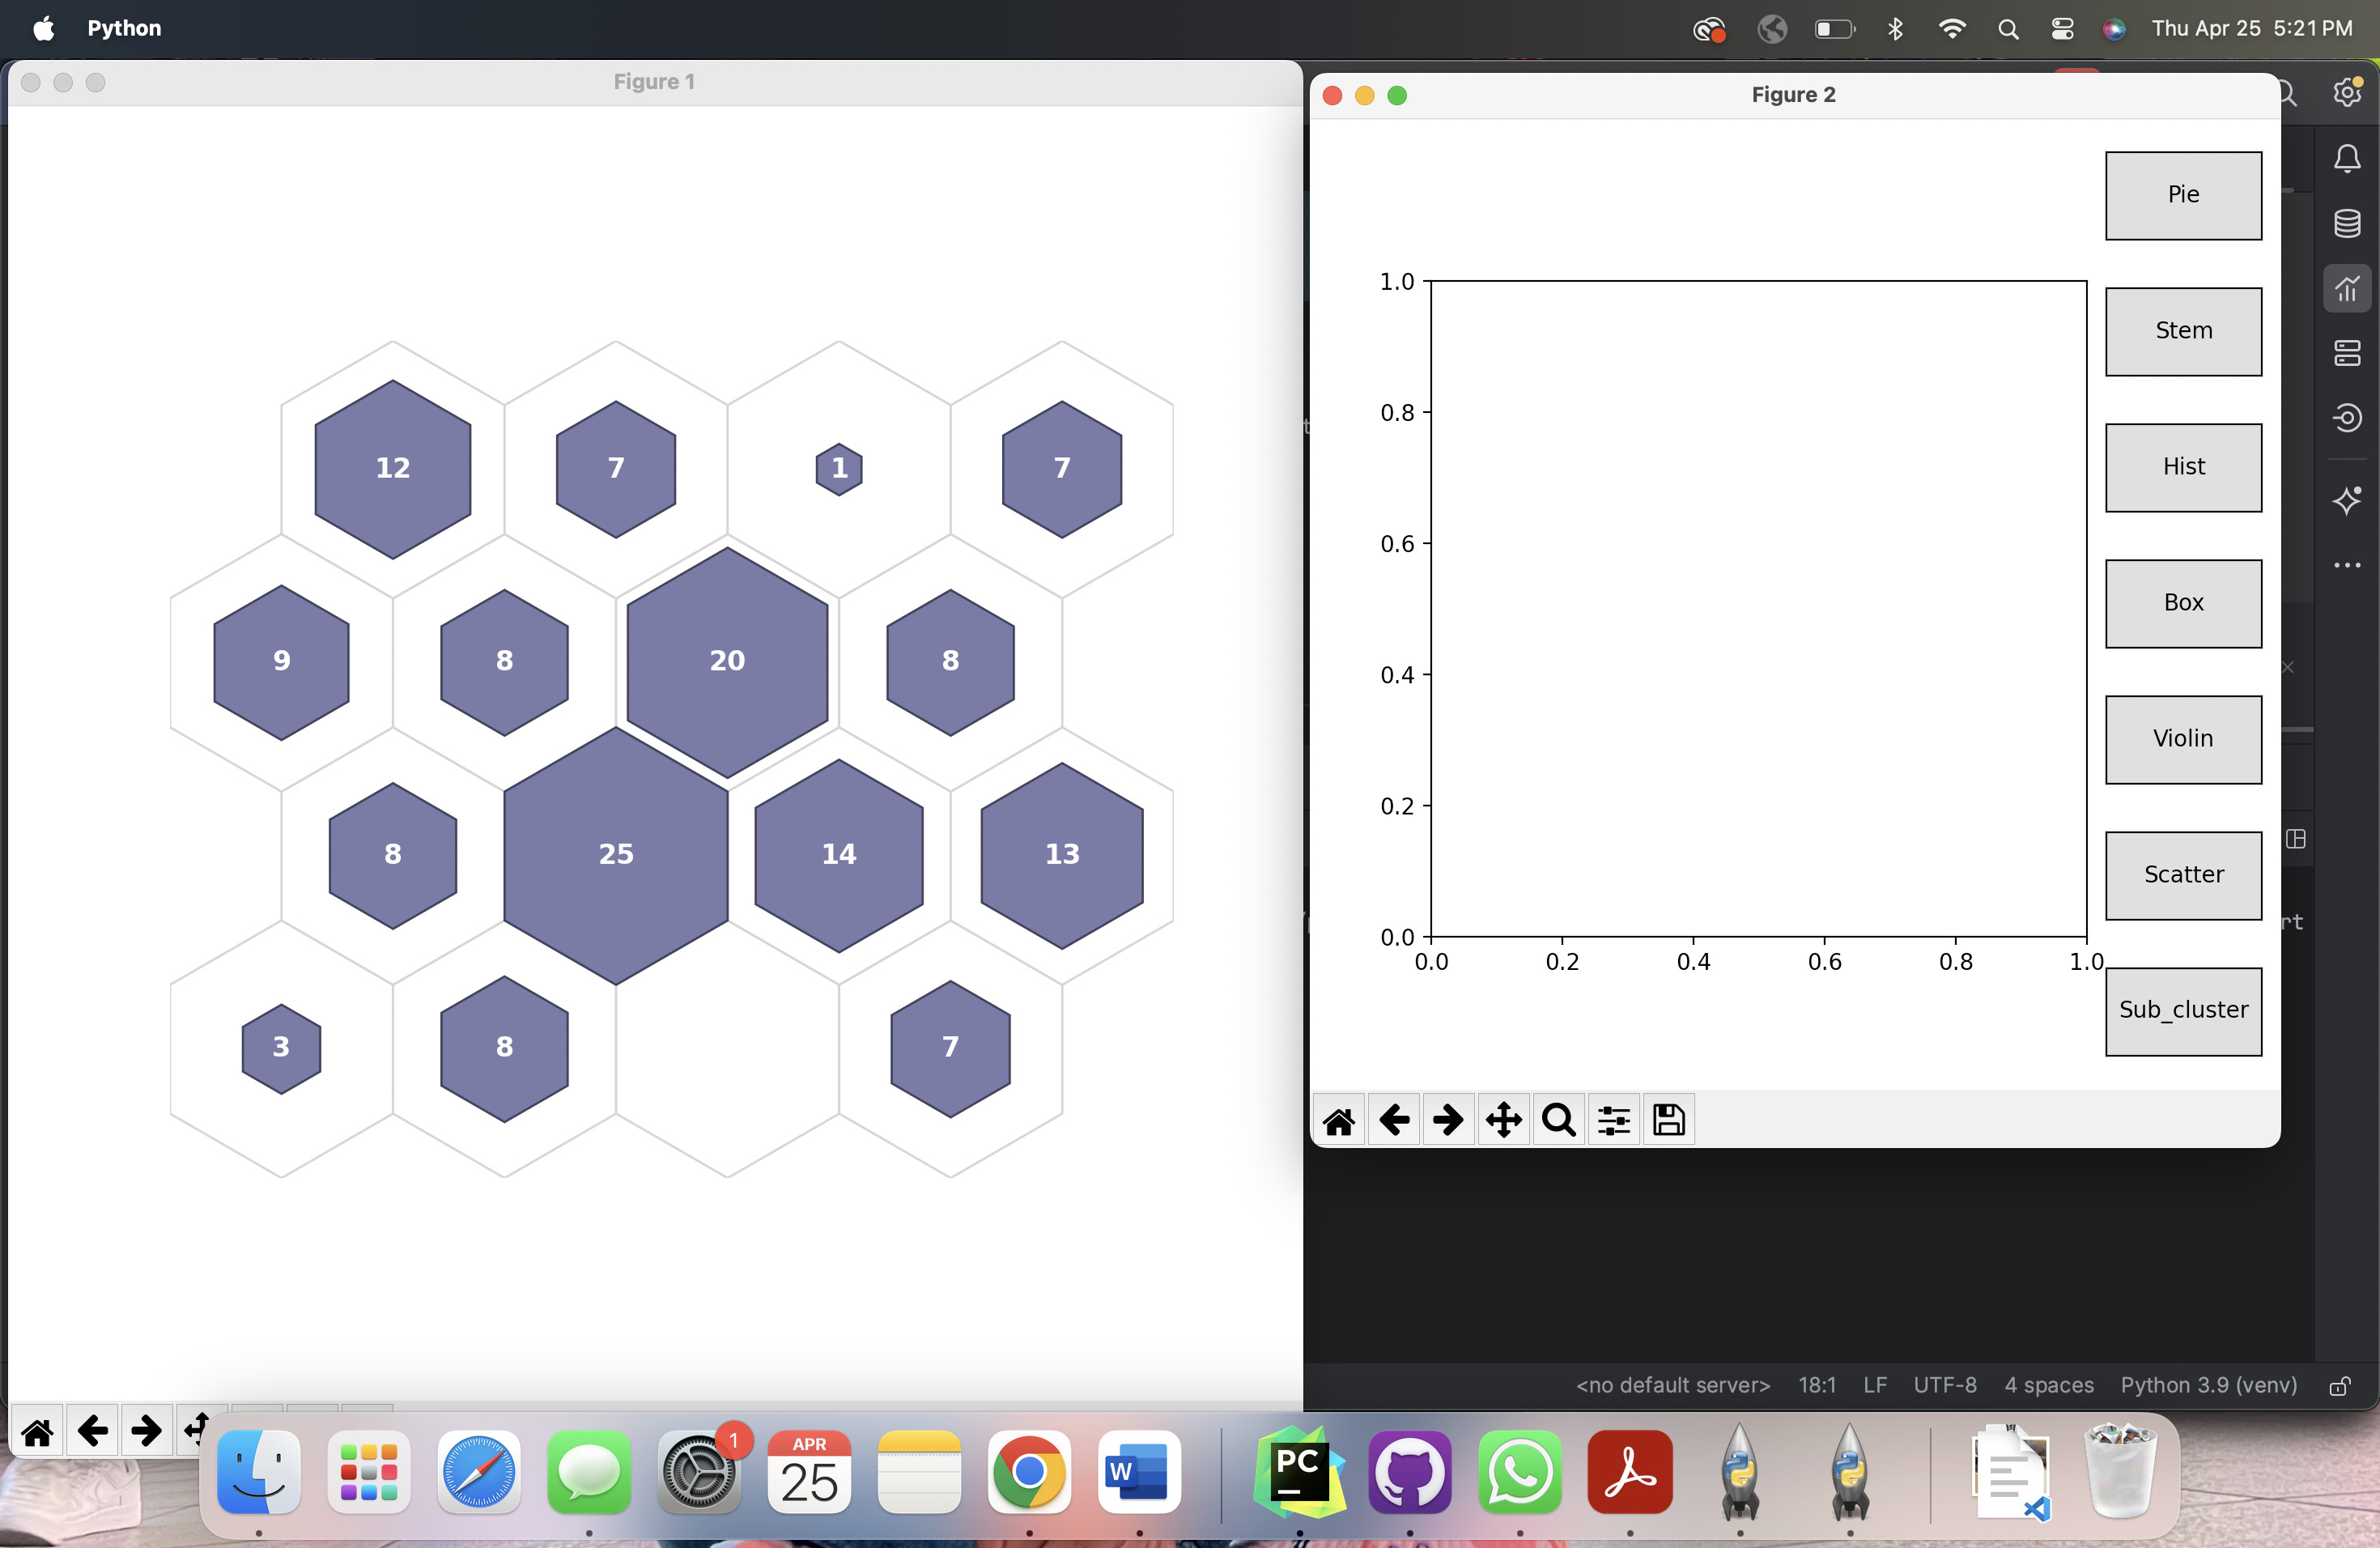
Initial interactive window (on clicking cluster center opens a menu)
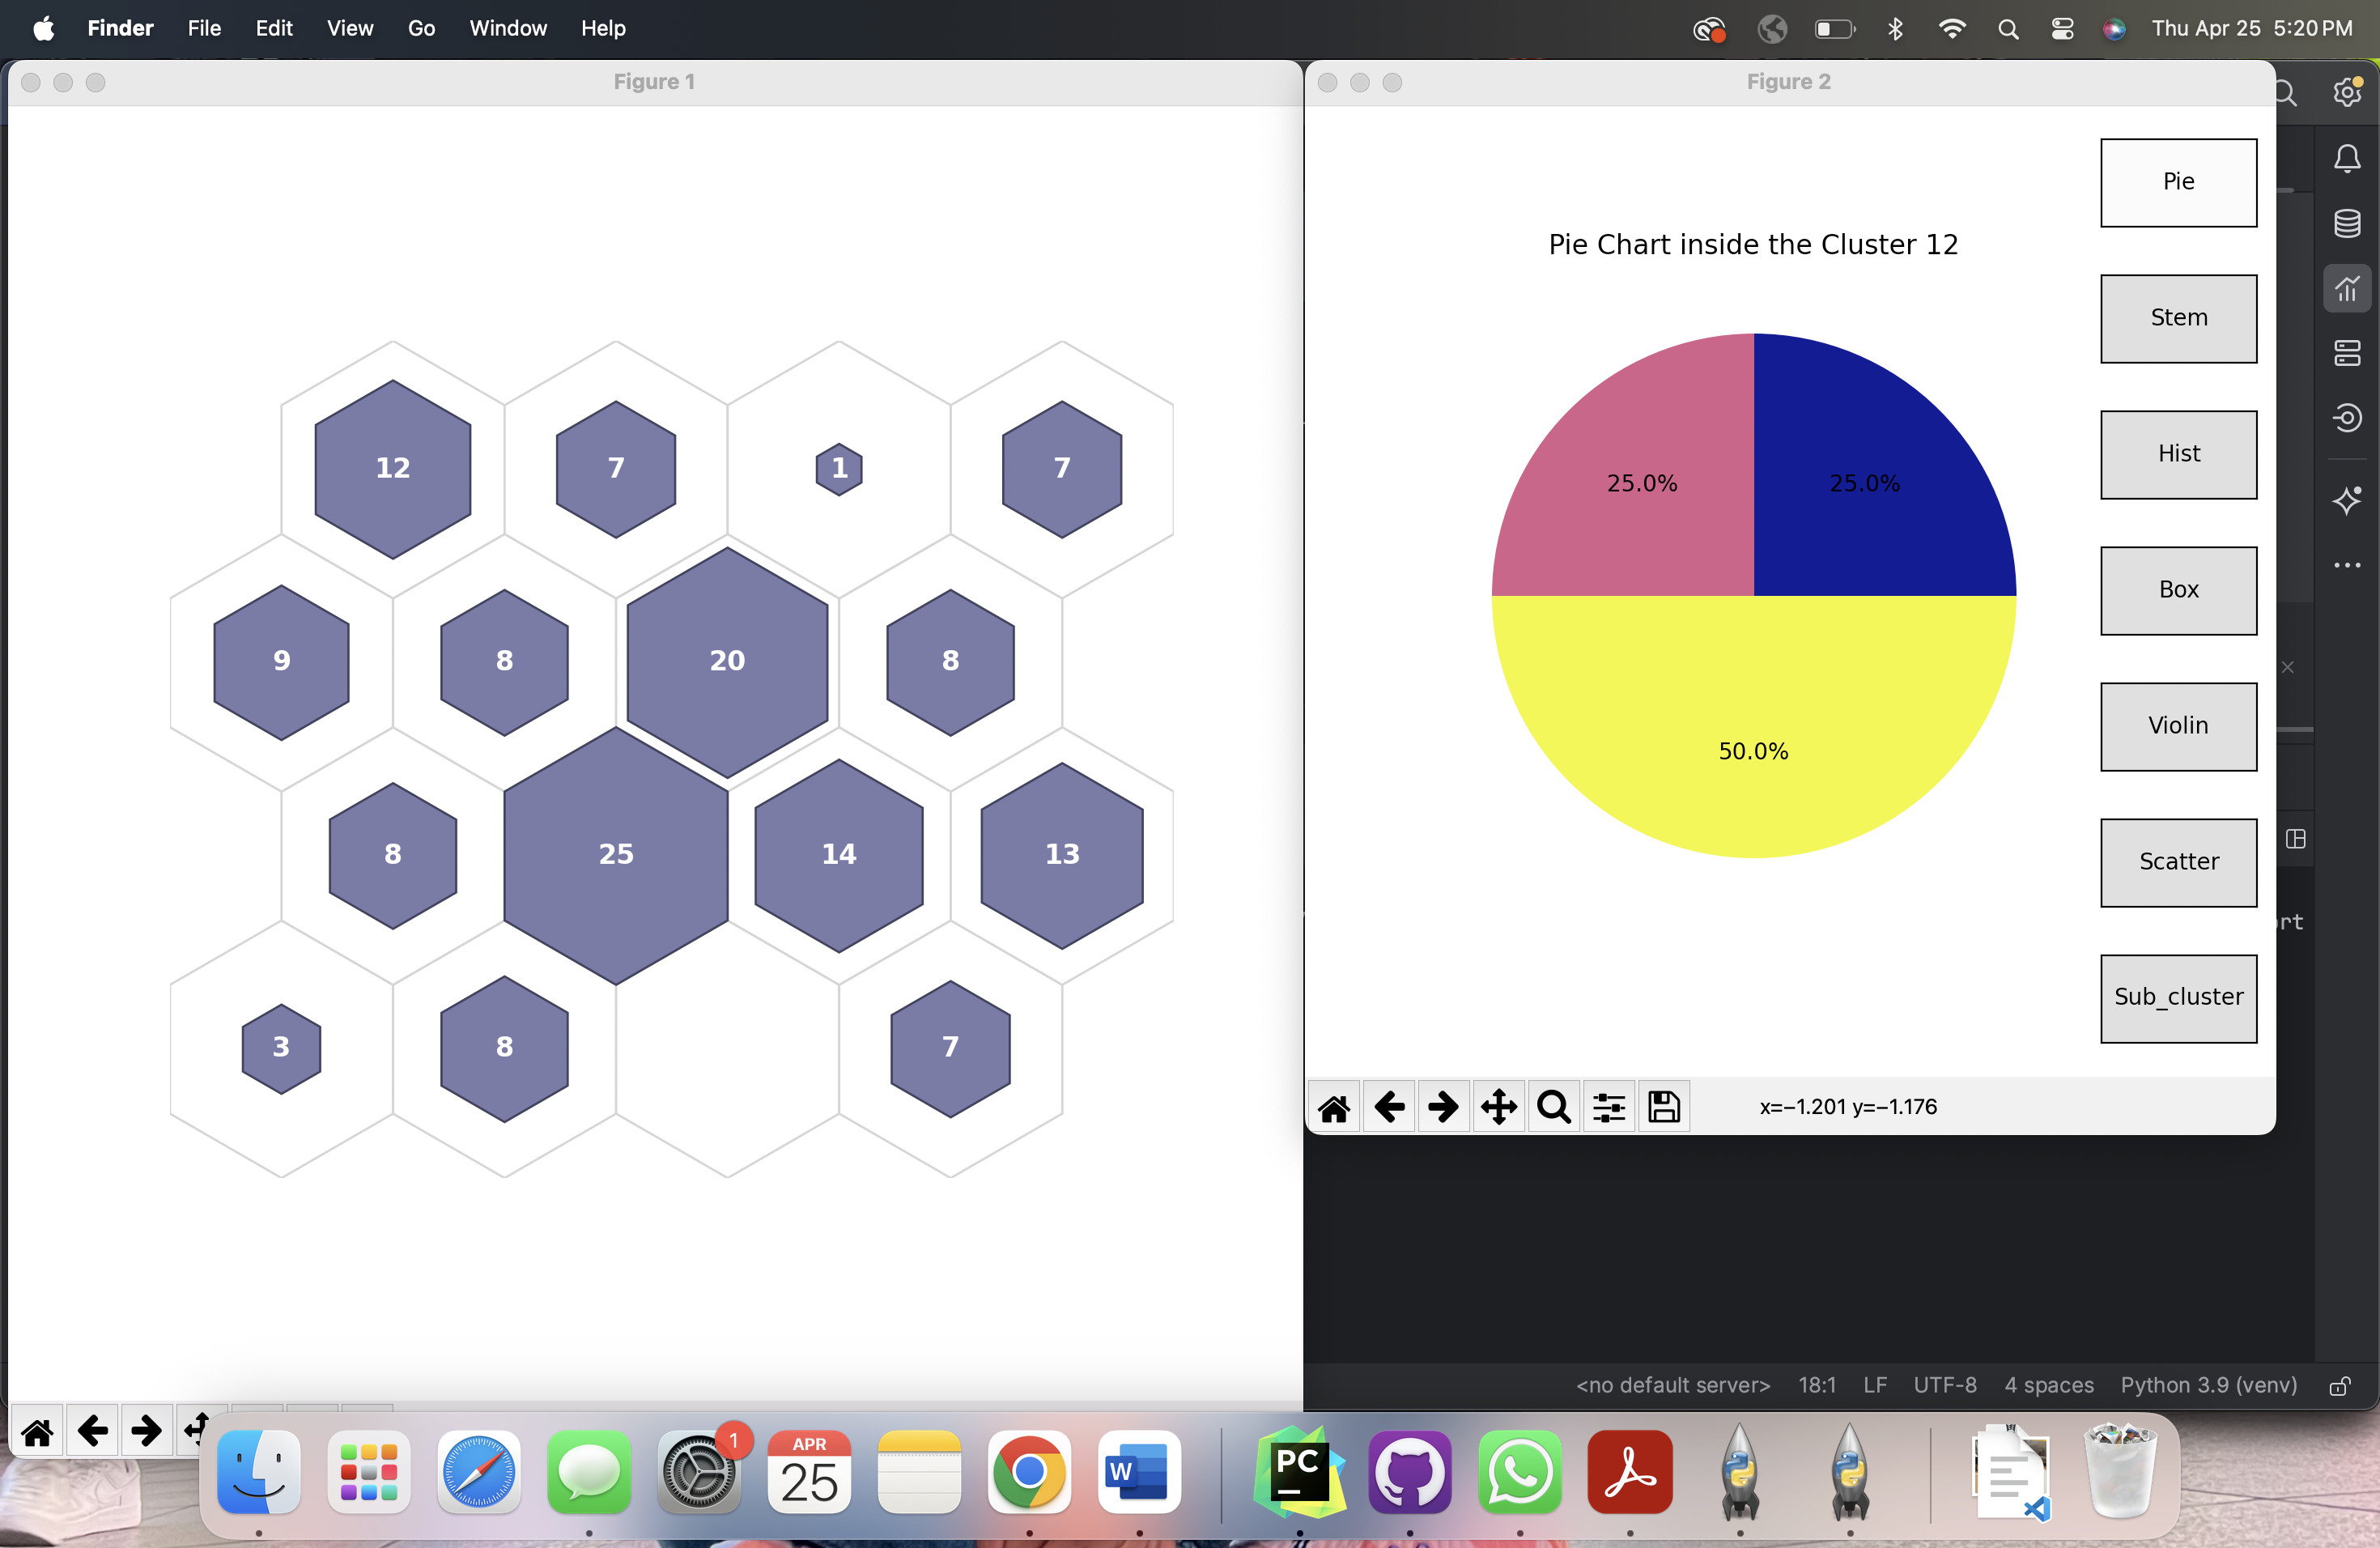
Clustered items as pie chart ( on clicking pie )
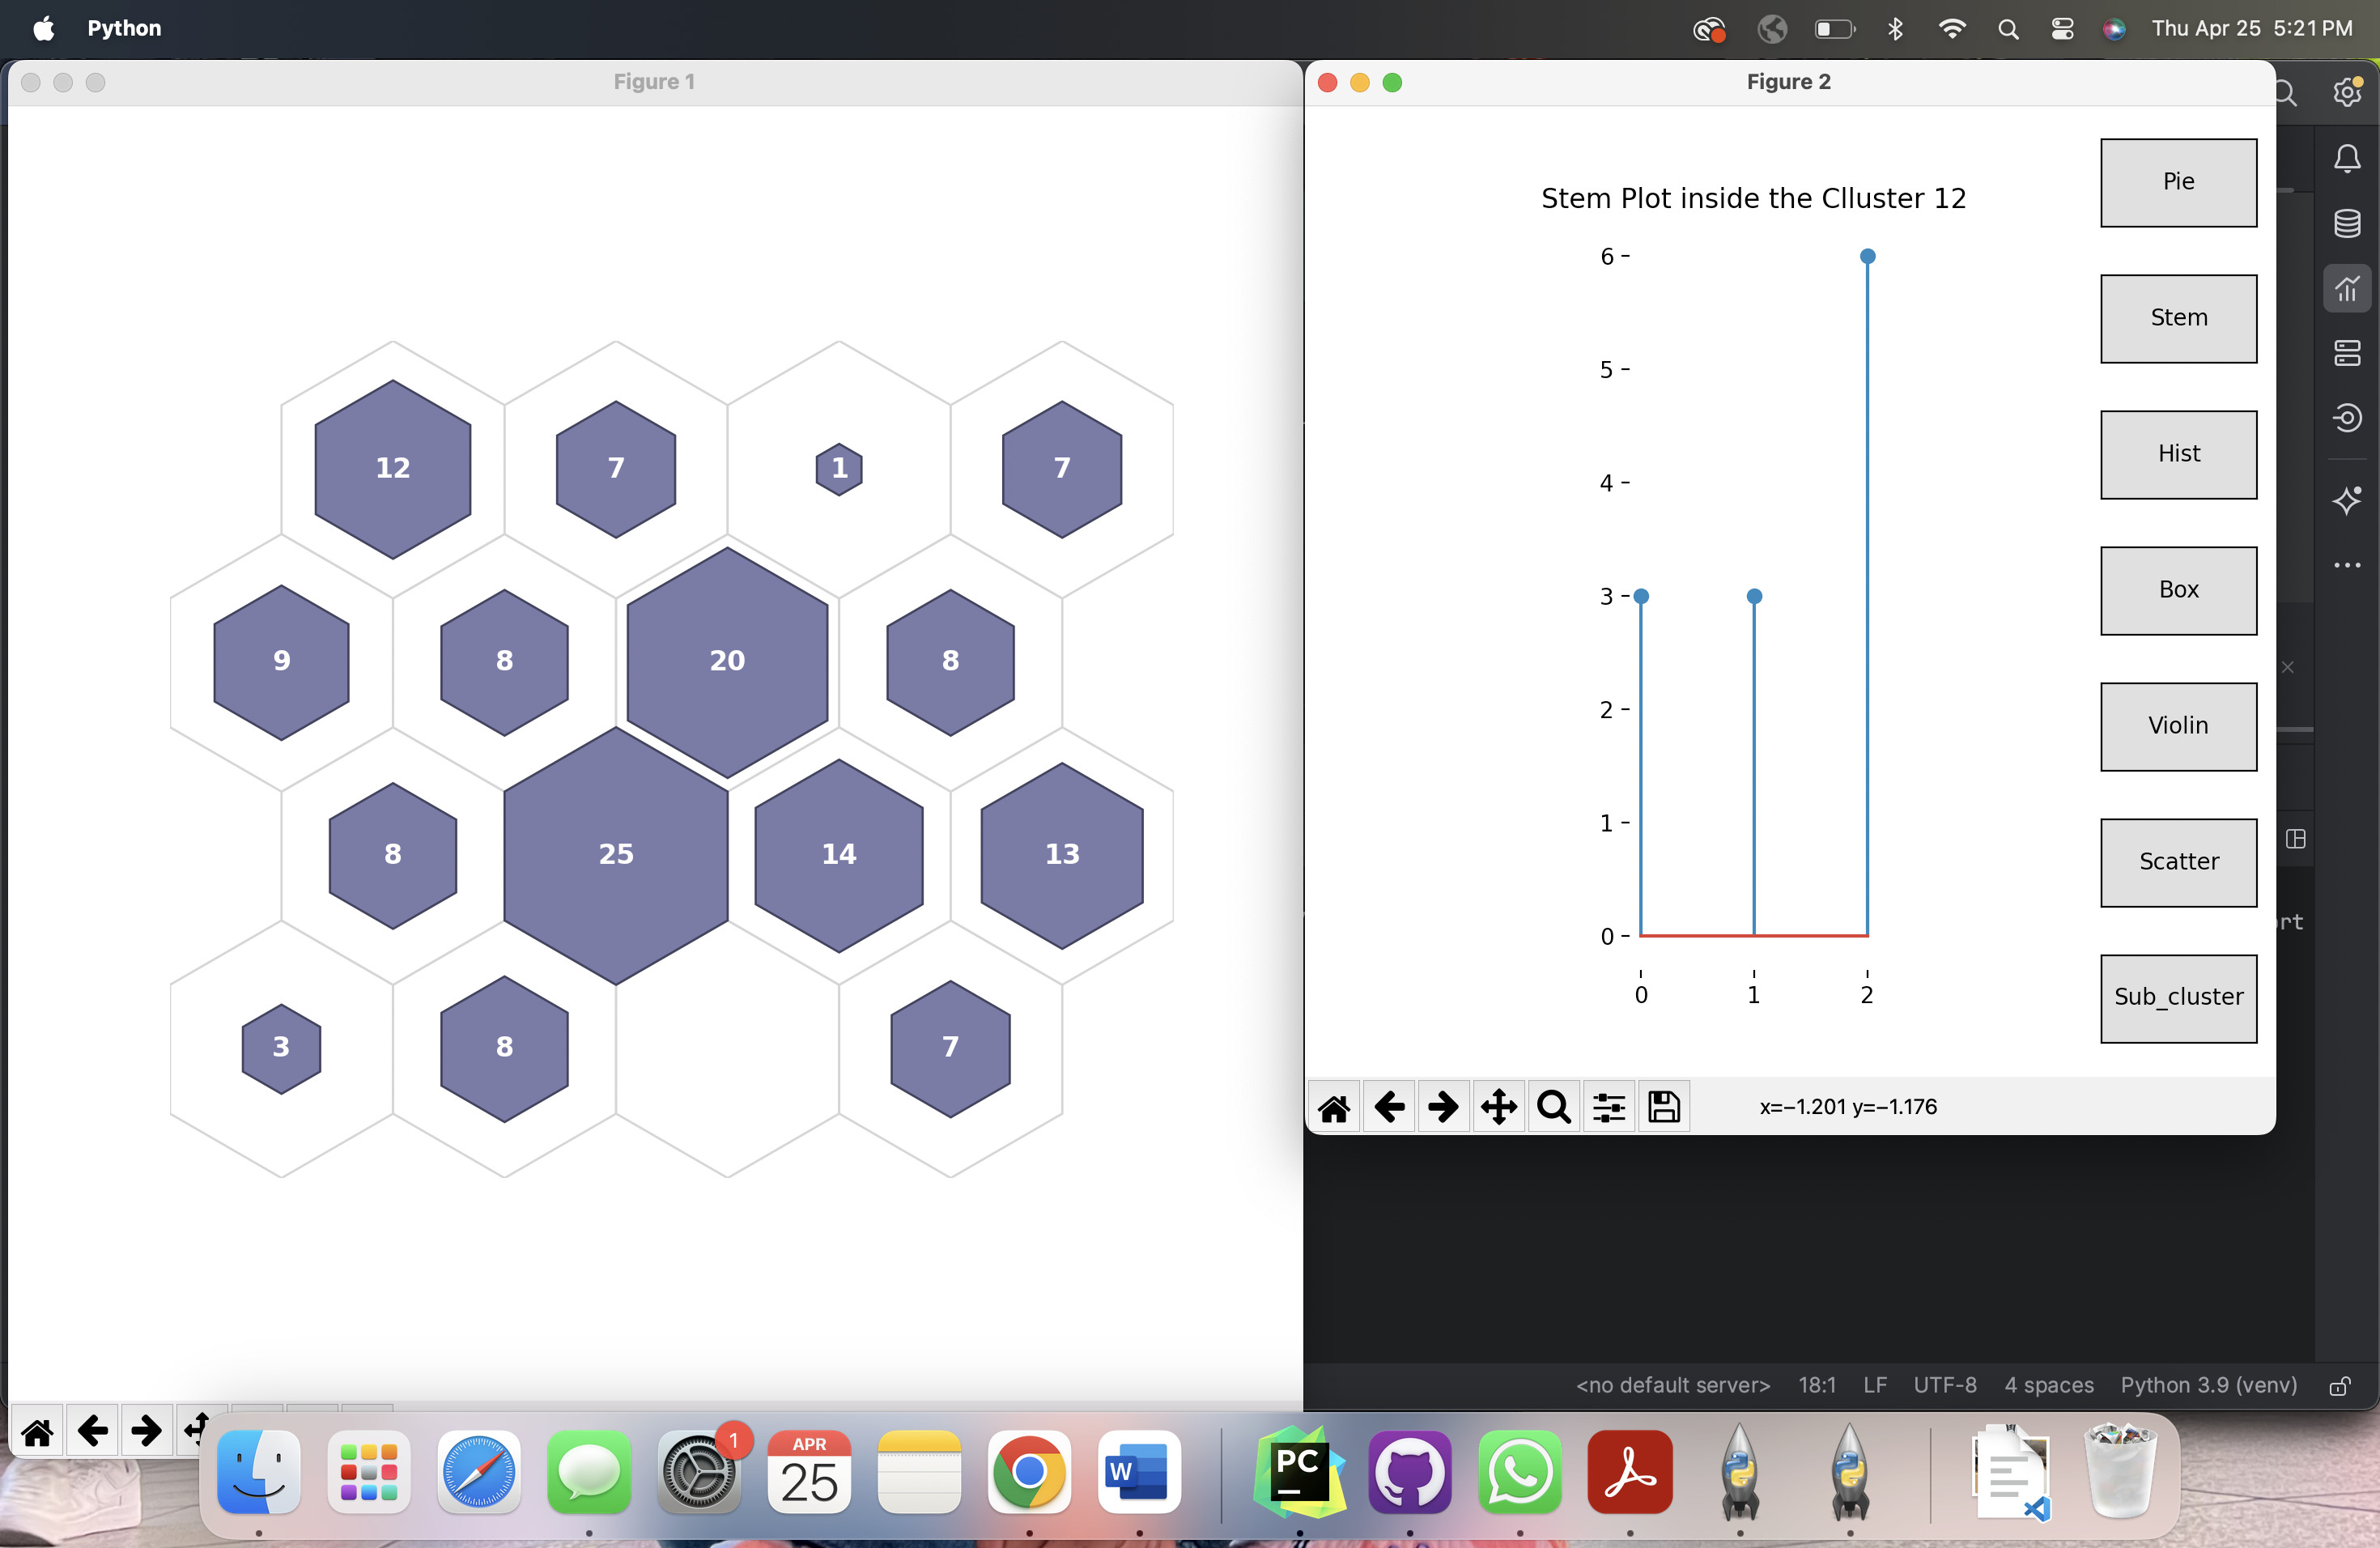
Clustered items as stem plot ( on clicking stem )
Conclusion
In this example we see the implementation of hit histogram to see whats inside the cluster. We can follow the same for all plots by just setting the flag mouse_click = True